

Global Broker Regulation Inquiry App
About WikiFX
English
简体中文
繁體中文
English
Pусский
日本語
ภาษาไทย
Tiếng Việt
Bahasa Indonesia
Español
हिन्दी
Filippiiniläinen
Français
Deutsch
Português
Türkçe
한국어
العربية
اردو


FPG XAUUSD Market Report August 10, 2026


Abstract:On the H1 timeframe, XAUUSD (Gold) remains in a strong bullish rally that has extended over the past week, with price continuing to trade within a broader upward structure. As illustrated on the chart
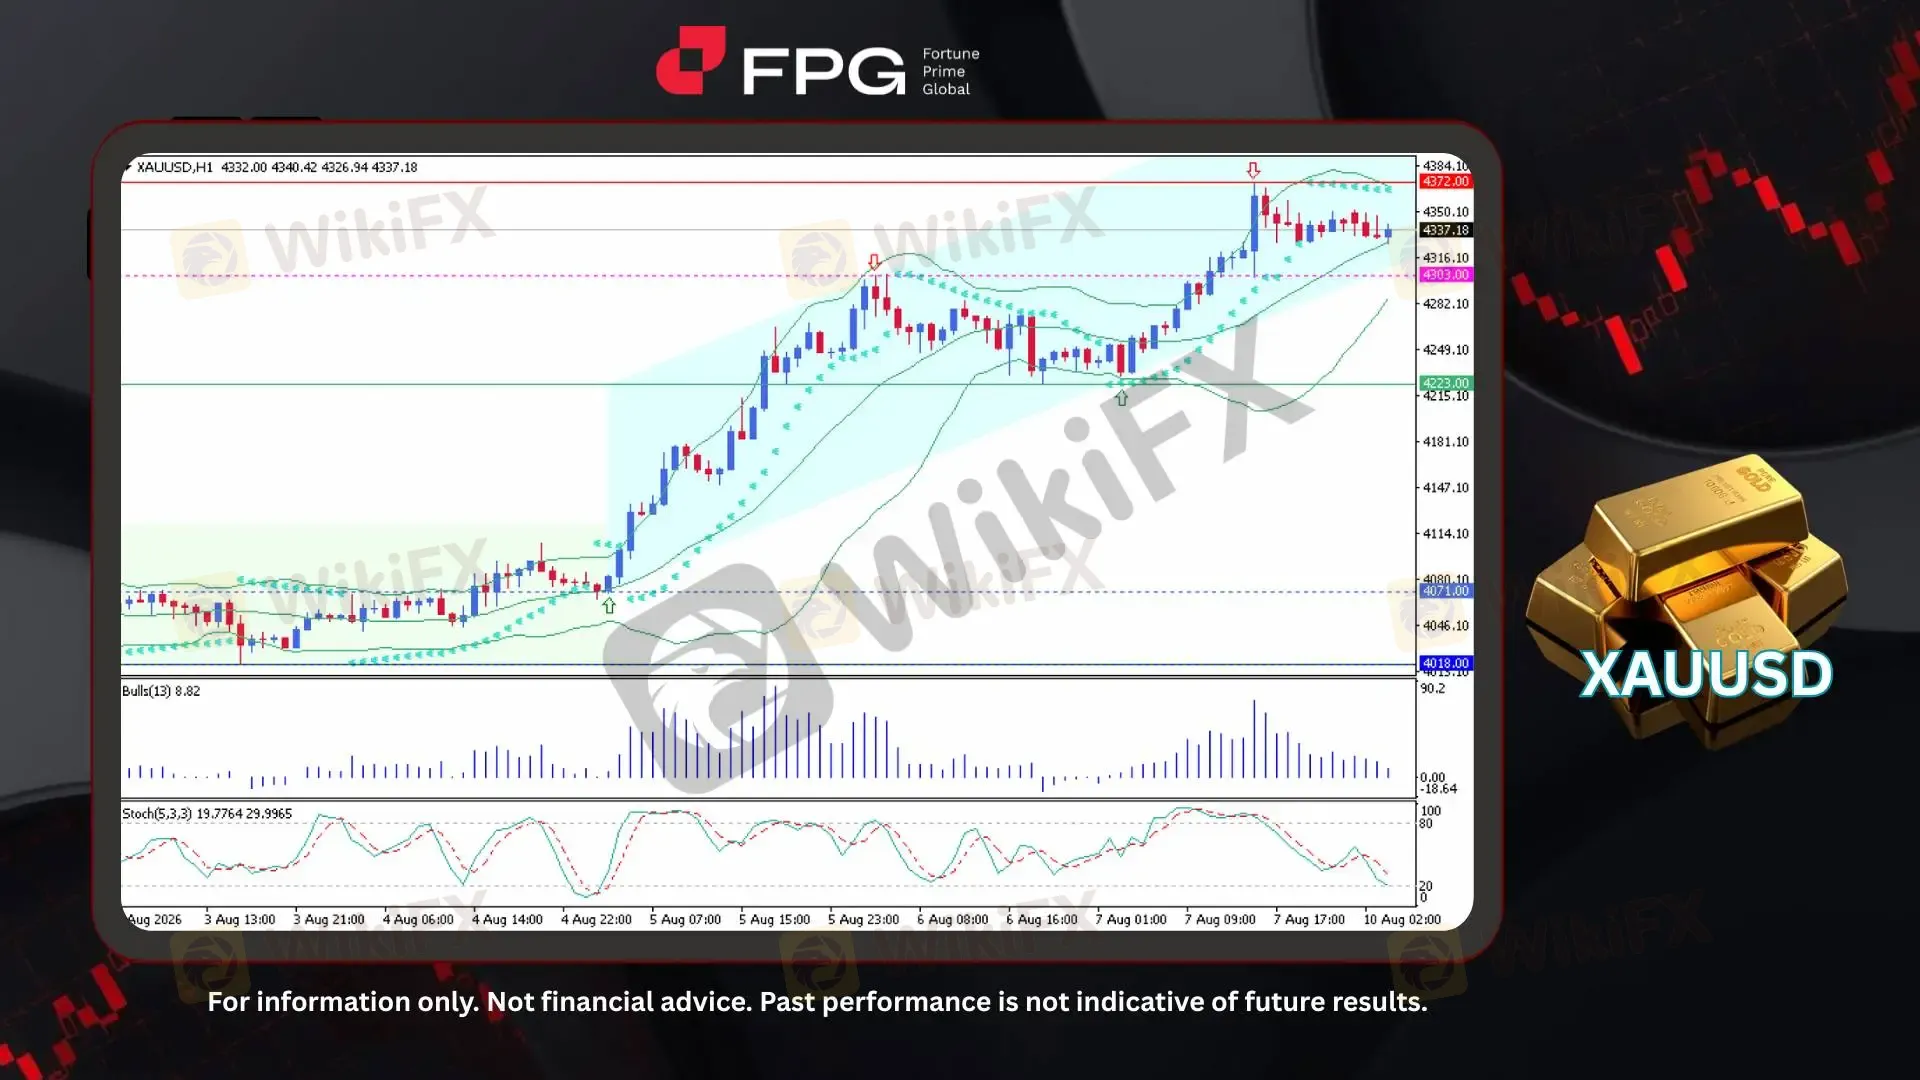
On the H1 timeframe, XAUUSD (Gold) remains in a strong bullish rally that has extended over the past week, with price continuing to trade within a broader upward structure. As illustrated on the chart, the rally began around 4,071 at the start of last week, followed by a sustained advance that pushed price through several key resistance levels before reaching a recent high of approximately 4,372. Following this peak, price has entered a consolidation phase and is currently trading around 4,337, while volatility remains moderate. The nearest support levels are positioned at 4,303 and 4,223, which could provide potential areas of interest if the consolidation develops into a deeper pullback.
The Bollinger Bands are beginning to narrow, indicating that volatility is moderating following the recent rally. Meanwhile, the SAR dots remain above the candles, suggesting that short-term bearish pressure persists despite the broader bullish structure. The Bulls Power indicator remains positive at approximately 8.82, reflecting continued underlying buying momentum. At the same time, the Stochastic indicator stands at approximately 19.78 and 29.99, with momentum approaching the oversold zone. This indicates that short-term selling pressure has increased and that the market may be entering a potential stabilization phase.
Over the past week, gold has been supported by weaker US labor data, lower Treasury yields, a softer US dollar, and reduced expectations for aggressive Federal Reserve tightening. Geopolitical uncertainty surrounding the US–Iran situation and the Strait of Hormuz has further strengthened safe-haven demand, while lower oil prices have helped ease inflationary pressures. Meanwhile, continued increases in Chinas gold reserves have reinforced expectations of sustained structural demand from central banks. Against this backdrop, XAUUSD remains in a bullish phase, supported by softer US economic data, lower yields, geopolitical risks, and continued central-bank demand, although the ongoing consolidation suggests that short-term bullish momentum may be moderating.
Technical Market Overview
1. Current Position: XAUUSD remains in a strong bullish structure on the H1 timeframe, currently trading around 4,337 following a recent high near 4,372. Price is consolidating after the strong rally from approximately 4,071.
2. Resistance Zone: Immediate resistance is located around 4,372, representing the latest swing high. A sustained break above this level could signal further continuation of the broader bullish trend.
3. Support Zone: The nearest support is positioned at 4,303, followed by a stronger support area around 4,223. These levels may provide potential stabilization zones if the current consolidation develops into a deeper pullback.
4. Indicator Observation: Bollinger Bands are narrowing, suggesting moderating volatility. SAR dots remain above the candles, indicating short-term bearish pressure, while Bulls Power remains positive at approximately 8.82. The Stochastic readings of approximately 19.78 and 29.99 indicate increasing selling pressure, with momentum approaching oversold territory.
5. Technical Summary: XAUUSD remains technically bullish, supported by its broader upward structure and positive Bulls Power reading. However, narrowing Bollinger Bands and the SAR positioning suggest that short-term momentum is currently weakening. A break above 4,372 would strengthen the bullish continuation scenario, while a decline toward 4,303–4,223 could indicate a deeper corrective phase.
Market Performance:
Precious Metals Last Price % Change
XPTUSD 1,731.79 −0.60%
XAGUSD 63.1610 −0.63%
Key Economic Calendar:
JP: BoJ Summary of Opinions
JP: Current Account
Risk Disclaimer: This report is for informational purposes only and does not constitute financial advice. Investments involve risks, and past performance does not guarantee future results. Consult your financial advisor for personalized investment strategies.
Disclaimer:
The views in this article only represent the author's personal views, and do not constitute investment advice on this platform. This platform does not guarantee the accuracy, completeness and timeliness of the information in the article, and will not be liable for any loss caused by the use of or reliance on the information in the article.
WikiFX Broker
Latest News
Traze Review: What Traders Should Know Before Depositing
 WikiFX
Match-Trade Gives AI Direct Access to Broker Trading APIs
WikiFXWhy Sovereign Debt Can Sink a Currency: The Credit Risk Channel
WikiFXUS July CPI Could Take a Fed Rate Hike Off the Table
WikiFXEMAR MARKETS Review 2026: Severe Withdrawal Complaints and Risk Signals
WikiFXBYBIT Review: What Traders Should Know Before Depositing
WikiFXPocket Broker Review: What Traders Should Know Before Depositing
WikiFXIC Markets Global Review for South Asian Traders: A Global License Isn't the Same as Local Permit
WikiFXiFX Brokers Review: Is Your Deposit Safe?
WikiFXONE ROYAL Faces SCM Malaysia Warning , What Traders Should Verify Before Funding an Account
WikiFX