
Global Broker Regulation Inquiry App
WikiFX
English
简体中文
繁體中文
English
Pусский
日本語
ภาษาไทย
Tiếng Việt
Bahasa Indonesia
Español
हिन्दी
Filippiiniläinen
Français
Deutsch
Português
Türkçe
한국어
العربية
Short-Term Narrative vs. Long-Term Narrative
Abstract:The long-term bullish narrative for precious metals is rooted in their role as a store of value. As such, structural investment flows tend to support a fundamentally constructive interpretation of gol
The long-term bullish narrative for precious metals is rooted in their role as a store of value. As such, structural investment flows tend to support a fundamentally constructive interpretation of gold and silver over time.
However, in the near term, rising volatility in gold and silver calls for a different framework. When prices experience sharp rallies and equally sharp pullbacks, the appropriate narrative shifts from investment-driven positioning to speculative dynamics. A “narrative,” in this context, refers to the logical framework used to interpret correlations and market behavior.
From a speculative standpoint, we derive a forward-looking signal: when Bitcoin stabilizes, upside momentum in gold and silver tends to moderate.
1. Silver-Linked Token Derivatives
During the early phase of this precious metals rally, mainstream cryptocurrencies such as Bitcoin remained subdued, lacking meaningful volatility over the past several months.
Crypto market participants typically seek short-term price acceleration and high volatility. As a result, speculative capital rotated into silver-linked token derivatives, particularly perpetual contracts offering leverage of 20x to as high as 200x.
This influx of crypto-native speculative capital drove daily notional trading volumes into the multi-billion-dollar range, becoming one of the three primary forces behind the surge in silver prices.
Although the order book size of silver token derivatives is relatively small, roughly $400 million, the broader stagnation in the crypto market effectively redirected internal speculative liquidity into this segment. The result was the formation of a significant bubble.
When that bubble unwinds, highly leveraged silver derivatives become the epicenter of forced liquidations. Notably, their price collapses have, at times, preceded declines in Bitcoin and other major cryptocurrencies.
2. Tether‘s Gold Purchases: 140 Metric Tons in One Year
As the issuer of the world’s largest stablecoin, Tether represents a substantial and increasingly influential force within the digital asset ecosystem.
With the rapid expansion of the stablecoin market, along with the issuance of gold- and silver-backed tokens, stablecoin issuers must continuously accumulate physical assets as underlying collateral.
Large-scale gold purchases are not purely directional bets on price appreciation. Rather, they are driven by the accelerating growth of stablecoin liabilities, which require backing through a combination of long-term Treasuries, short-term government securities, and gold.
After acquiring approximately 140 metric tons of gold within a single year, Tether continues to purchase gold at an estimated pace of roughly one metric ton every three to four days. This acquisition rate now exceeds that of most central banks globally, including those of the United States and China.
While Tethers gold accumulation has become a short-term driver of precious metals prices, stablecoin issuers more broadly are poised to become an increasingly powerful force across global financial markets, including the precious metals complex.
Therefore, if Bitcoin and other cryptocurrencies re-enter a strong uptrend accompanied by heightened volatility, it would likely re-satisfy the speculative appetite of crypto traders. This could trigger a rotation of highly active, multi-billion-dollar speculative capital back into digital assets.
Gold Technical Analysis
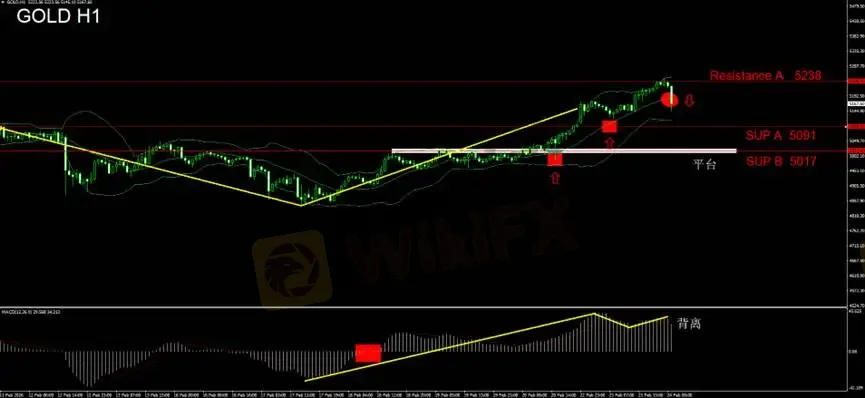
Bollinger Bands
Using Bollinger Bands to track the prevailing trend, the current hourly candlestick has broken below the middle band, indicating that the short-term trend has entered a consolidation phase.
Long positions established yesterday should be exited and sidelined. The profit from that trade was limited.
MACD Oscillator
The MACD oscillator shows a bearish divergence at the top, suggesting that upside momentum is fading. Investors should remain alert to the risk of a short-term pullback.
Key Support Levels
On the downside, key technical support is located near the platform consolidation zone around 5017. For now, this should be interpreted as a corrective pullback within a broader short-term bullish structure.
Trading Recommendation
Remain flat.
Resistance
5238
Support
5091 / 5017
Risk Disclosure
The above views, analysis, research, pricing, or other information are provided solely as general market commentary and do not represent the position of this platform. All readers assume full responsibility for their own investment decisions. Please trade prudently and manage risk accordingly.
Disclaimer:
The views in this article only represent the author's personal views, and do not constitute investment advice on this platform. This platform does not guarantee the accuracy, completeness and timeliness of the information in the article, and will not be liable for any loss caused by the use of or reliance on the information in the article.
WikiFX Broker
Latest News
Kudotrade Review 2026: Is this Forex Broker Legit or a Scam?
 WikiFX
BitPania Review 2026: Is this Broker Safe?
WikiFXGFS Review: Reported Allegations of Fund Scams & Withdrawal Denials
WikiFXXTB Analysis Report
WikiFXIs EXTREDE Regulated? A 2026 Investigation into Warning Signs and Licensing Claims
WikiFXKey Events This Week: PPI, Iran Talks, Nvidia Earnings, Fed Speakers Galore And State Of The Union
WikiFXWhat Causes Stagflation?
WikiFXEU Says Trump's Tariff Workaround Violates Trade Deal
WikiFX$128M Crypto Scam: Chinese Suspect Nabbed in Thailand
WikiFXIs AssetsFX Safe or Scam: Looking at Real User Feedback and Complaints
WikiFXCurrency Calculator
USD

CNY
Current Rate:0
Amount
USD
Available
CNY
Calculate 